Digital Product Store

Market Profile Strategy

Can Market Profile Give You an Edge in Intraday Trading?

Want market success? Mastering key price levels is the key, and the Market Profile is your tool. Unlike traditional charts, Market Profile with volume study organizes market generated information to highlight trading areas. This article will teach you to identify crucial levels like the Point of Control (POC), Value Area High (VAH), and Value Area Low (VAL), which signal potential market stabilization, reversals, or breakouts. We’ll explore strategies for trading these levels in breakouts, reversals, and range-bound markets, enabling you to make more informed entry and exit decisions. Let’s begin.

Market Profile: A Powerful Tool for Intraday Trading

Market Profile is a technical analysis tool that visually represents market activity as a distribution curve, showing the distribution of trading volume across price levels over a specific time period. Unlike traditional candlestick or bar charts that focus solely on price changes over time, Market Profile emphasizes *where* the most trading occurred at various price points. This reveals areas of significant buying and selling pressure.
By analyzing the price distribution and volume within the Market Profile, traders gain a clearer understanding of what prices market participants consider “fair value”. Key insights come from the “Point of Control” (POC), the price level with the highest trading volume, and surrounding areas of high activity. Understanding the POC and related volume distribution allows traders to make better intraday trading decisions. The Market Profile uses time-based data to create this distribution curve.
Market Profile is a valuable tool for intraday traders because it helps gauge market sentiment and pinpoint potential trend reversals. By analyzing the volume distribution, traders can identify support and resistance levels, and discern between trending and ranging markets. The Market Profile’s distribution curve even helps predict the day’s likely high and low, allowing traders to design strategies that capitalize on price movements within those predicted ranges. The following section will detail practical applications of Market Profile in intraday trading strategies.

Options wheel strategy explained

The wheel strategy can be thought of as an active approach to passive investing that allows investors to generate consistent income. It is perfect for stock investors looking for a simple transition to options trading.

The options wheel strategy consists of two main components:

  1. Selling a cash-secured put option
  2. Selling a covered call if assigned stock

You can go back to step 1 to restart the “wheel” and continue the process:

Selling the short put option receives a credit for the option contract’spremium amount. Put options are typically sold out-of-the-money below the stock’s current price. Selling cash-secured puts ensure enough capital is available to take assignment if needed. However, if you are not assigned, you can continue selling puts and collecting premium.

The covered calls can be sold repeatedly until the net stock cost basis is below the current stock share price. Ideally, the stock price increases slightly, but the short call expires out-of-the-money. This allows you to keep the entire premium and sell another call option for the next expiration, continuing to reduce the position’s net cost basis with each trade. The shares can then be called away or sold for a net profit. The wheel strategy continues for as long as you want to hold the underlying stock, or the call option expires in-the-money and the shares are called away and a new short put may be sold to start the wheel over again.  

Learn more about options assignment.

Mastering Key Market Profile Levels for Intraday Trading

Effective intraday trading relies on understanding key Market Profile levels: the Point of Control (POC), Value Area High (VAH), and Value Area Low (VAL). These levels pinpoint areas of highest trading activity, guiding entry, exit, and reversal decisions.
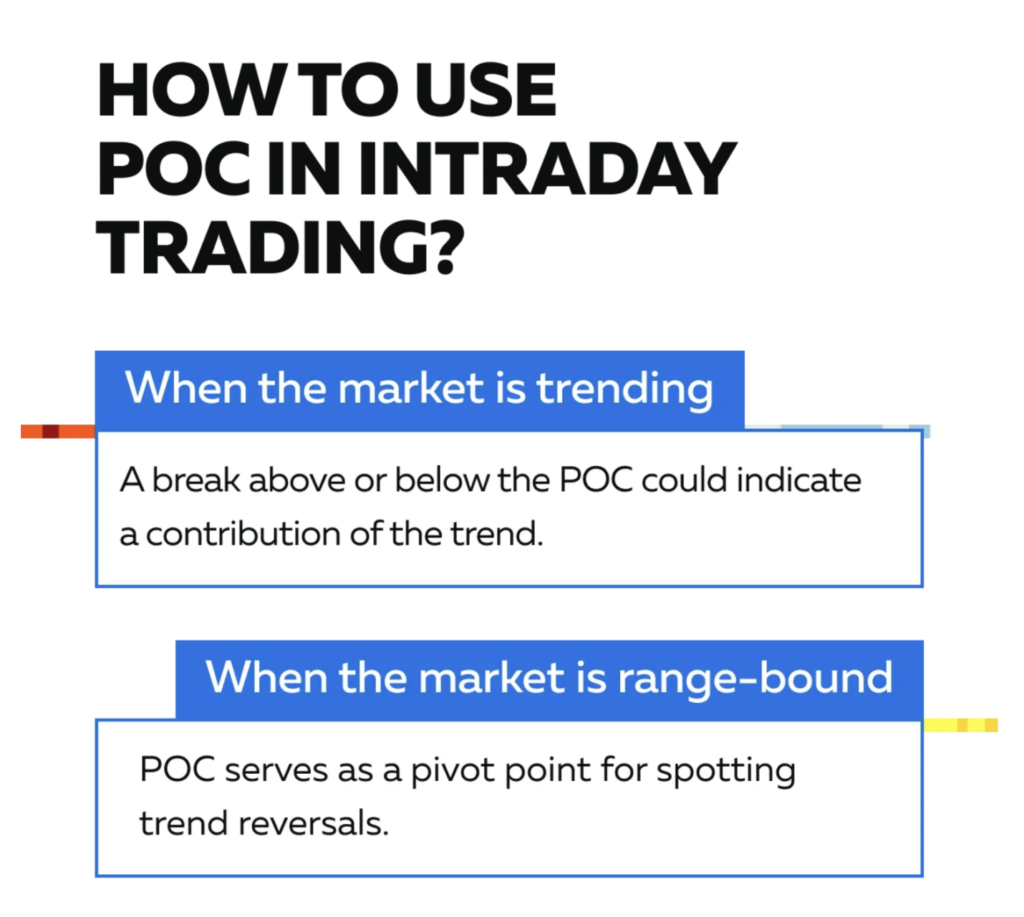
**The Point of Control (POC):** The POC represents the price level with the highest trading volume over a given period. It signifies the price most traders considered “fair value.” Traders often use the POC as a potential entry or exit point, leveraging its significance in market dynamics.

Understanding the Value Area (VA) in Market Profile Analysis

The Value Area (VA) on a Market Profile chart encompasses the price range where 70% of trading activity occurred during a specific period. This range represents a zone of equilibrium where buying and selling pressures were relatively balanced. Prices remaining within the VA suggest a balanced market, while moves outside the VA often signal potential trading opportunities like breakouts or pullbacks. The VA’s boundaries—the Value Area High (VAH) and Value Area Low (VAL)—are key support and resistance levels, crucial for trade planning. Many traders focus on the VAH and VAL to identify potential reversals or trend continuations. The following section will detail how to use the VAH and VAL in developing trading strategies.

Dynamic Value Areas and Intraday Strategy Adjustments

The Value Area is not static; it shifts throughout the trading day, creating new areas of value. Traders track these shifts using tools like volume profiles and real-time Market Profile charts to adapt their strategies. Expansion or contraction of the Value Area reflects changes in market sentiment and trading activity.
For example, an upward shift in the Value Area suggests bullish sentiment and a potential upward trend, indicating a willingness to trade at higher prices. A trader might then focus on long trades, buying on pullbacks near the newly formed VAL, using the new VAH as a profit target or resistance level, and exiting long positions if the price reaches the VAH or shows signs of reversal.

Now, let’s study some popular trading strategies in detail:

Market Profile Breakout Strategy

One common Market Profile trading strategy involves identifying and trading breakouts. A breakout occurs when price decisively moves beyond the Value Area, particularly above the Value Area High (VAH) or below the Value Area Low (VAL), accompanied by strong volume. This signals a potential trend continuation.

**Steps:**

1. **Identify the Breakout:** Watch for price approaching and breaking above the VAH (bullish breakout) or below the VAL (bearish breakout) with significant volume.

2. **Enter the Position:** Enter a long (buy) position for a bullish breakout above the VAH or a short (sell) position for a bearish breakout below the VAL.

3. **Set Stop-Loss:** Place a stop-loss order just below the VAH (bullish) or above the VAL (bearish) to manage risk and limit potential losses in case of a false breakout.

4. **Set Profit Target/Trailing Stop:** Determine a profit target based on the next significant resistance or support level, or employ a trailing stop to lock in profits as the price moves favorably.

Mean Reversion Strategy Using Market Profile

Market Profile can be used to identify mean reversion opportunities. This strategy targets price extremes relative to the Point of Control (POC), anticipating a return to the POC, which represents a fair value area.
If the price moves significantly above the POC, for example, a trader might enter a short position, expecting a reversion towards the POC. Risk management involves setting a stop-loss order above the recent high. The profit target would typically be set near the POC. The same principle applies to long positions when the price moves significantly below the POC.

Range-Bound Trading with Market Profile

Market Profile is valuable for trading within defined ranges, particularly during periods of low volatility. This strategy involves buying near the Value Area Low (VAL) and selling near the Value Area High (VAH), capitalizing on predictable price oscillations within the established range.

**Steps:**

1. **Buy at VAL:** Enter a long position when the price approaches the VAL, anticipating a price rebound towards the VAH.

2. **Stop-Loss Below VAL:** Set a stop-loss order slightly below the VAL to limit losses should the price break down.

3. **Sell at VAH:** Exit the long position by selling near the VAH, expecting a pullback from this resistance level.

4. **Repeat:** Continue this process of buying near the VAL and selling near the VAH to profit from the range-bound price movements.

Conclusion:

Market Profile significantly enhances intraday trading decisions. By identifying key levels like the Point of Control (POC), Value Area High (VAH), and Value Area Low (VAL), traders gain insights into trading activity and potential market behavior—stabilization, reversal, or breakout. This leads to more informed entry and exit decisions, such as buying near the VAL or selling near the VAH in range-bound markets, or anticipating breakouts and reversals based on volume concentration. Market Profile ultimately provides a deeper understanding of market dynamics and improves opportunity identification.

Sell a put option

You can sell the short put at any strike price. Many investors use the short put as an income-generating, proxy limit order and will often sell options at a price they believe is a key technical support level.

In this way, you essentially get paid to initiate a long equity position in the underlying security at a price you’d be happy to buy shares.

If the underlying security’s price is above the short put option’s strike price at expiration, the contract expires worthless, and you keep the premium received for selling the put.

You can repeat the process for as long as you wish and adjust the strike price up or down as your bias or market conditions change.


If the stock is below the strike price at expiration, you will be assigned 100 shares per contract at the strike price. However, the position’s cost basis is reduced by the net credit of any put options sold.

For example, if you sell a put with a $100 strike price and collect $5.00 of premium, your cost basis is $95 if you’re assigned stock.

Because you will buy 100 shares per contract if assigned, your account must have available funds to purchase 100 shares.

Selling a $100 strike put option requires you to have at least $10,000 in your account.

Rolling the short put can be an effective way to potentially delay assignment while collecting additional premium. The premium increases the profit if the stock’s price recovers, or lowers the net stock cost basis if assigned. 


Sell a covered call

If you’re assigned stock, you’ll initiate a covered call. The short call option also brings in credit and generates income. You can think of the covered call as the monthly rent you collect for owning the stock (and don’t forget about collecting dividends along the way!).

For example, if you own stock at $100, you could sell a covered call with a $105 strike price. If you collect $5.00 for selling the call, you’ve reduced the position’s cost-basis to $95 (plus any premium received from selling put options).

If the stock price is above the call option’s strike price at expiration, the shares will automatically be sold at the strike price, and any further gains are not realized. Therefore, covered calls are typically sold at or above a pre-determined profit target you would be happy to sell the shares.

For example, if the stock is $110 at expiration, you’re required to sell shares at the call option’s $105 strike price. You’ll still keep the premium collected for selling the option, but you would forfeit any price appreciation above the strike price.

Like short puts, you can also roll a call option to potentially bring in more premium, extend the trade, and sell a higher strike price. 

Again, the premium collected from selling options continues to lower the position’s overall cost basis. The closer the short call’s strike price is to the current stock price, the more money you will collect, but there’s a higher probability the option will expire in-the-money (you can use delta to determine probabilities). 

Also, options contracts with longer expiration dates have higher premiums but, again, a higher probability the option will expire in-the-money. These are factors you will need to consider when selecting a call option.

Wheel strategy example

Let’s assume a stock is trading at $67. You’ve determined you would be willing to own at least 100 shares at $65. You can sell a cash-secured put with a $65 strike price. The longer-dated the contract’s expiration, the more money you’ll collect because the option will have more extrinsic value.

If the stock is above the strike price at expiration, you can repeat the process for a later expiration date. If the stock trades down to $65 or lower, you may be assigned shares at $65. The premium collected on any put options reduces your cost basis. 

Once you own the stock, you could then sell a call option with a $68 strike price, further reducing your cost basis. If the stock is not called away because the stock does not trade up to the call option’s strike, the call selling is repeated the next month. If the stock is above the call option’s strike price, you must sell shares at $68, regardless of the underlying’s price.

Important considerations

Remember, the wheel option is ideal for a stock you want to own, so you have a bullish bias in the short, medium, or long-term (up to you to decide the timeframe). Selling a put option to initiate stock ownership lets you collect money while waiting for assignment. Of course, there is always the possibility that the stock won’t trigger assignment, and you’ll never own the stock. However, you’ll still keep the premium collected for selling the put.

While selling calls reduces the position’s cost basis, they limit its upside profit potential. Consider your long-term bias for the stock. The wheel strategy can go on for weeks, months, or years depending on the stock’s price movement. Have a defined plan for position management, and consider this checklist before initiating a position:

Shopping Cart
  • Your cart is empty.